• Home
  • Blog
  • Data
  • Elementary Science
    • 4K Science Suggestions
    • 5K Science
    • 1st Grade Science
    • 2nd Grade Science
    • 3rd Grade Science
    • 4th Grade Science
    • 5th Grade Science
  • Middle School Science
    • 6th Grade Science >
      • 6thSCREADYPrep
    • 7th Grade Science
    • 8th Grade Science
    • MS SCPASS Preparation
    • Workshop Model
    • Lab Reports
  • High School Science
    • Workshop Model
    • Biology >
      • Biology EOC Review >
        • Biodata2022
      • Bio NGSS
    • HS Science Resources
    • ACT Science Prep
    • ASVAB Prep
  • More
    • ScienceFair
    • ESOL
    • 2021 SC Science Standards - NEW!
    • Lab Safety
    • Science & Engineering Practices
    • Disciplinary Literacy
    • COVID-19
    • STEM
    • Remote Learning Resources
SCIENCE EDUCATION MATTERS
  • Home
  • Blog
  • Data
  • Elementary Science
    • 4K Science Suggestions
    • 5K Science
    • 1st Grade Science
    • 2nd Grade Science
    • 3rd Grade Science
    • 4th Grade Science
    • 5th Grade Science
  • Middle School Science
    • 6th Grade Science >
      • 6thSCREADYPrep
    • 7th Grade Science
    • 8th Grade Science
    • MS SCPASS Preparation
    • Workshop Model
    • Lab Reports
  • High School Science
    • Workshop Model
    • Biology >
      • Biology EOC Review >
        • Biodata2022
      • Bio NGSS
    • HS Science Resources
    • ACT Science Prep
    • ASVAB Prep
  • More
    • ScienceFair
    • ESOL
    • 2021 SC Science Standards - NEW!
    • Lab Safety
    • Science & Engineering Practices
    • Disciplinary Literacy
    • COVID-19
    • STEM
    • Remote Learning Resources

Data Analysis

Heating Curve

9/30/2021

0 Comments

 
Examine the heating curve of ice to steam.  Answer the questions below.
Picture
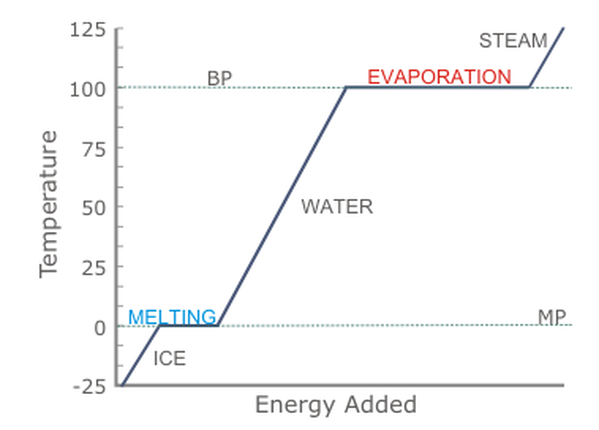
Graph is from: https://coordinatedscience1.wordpress.com/lessons/unit-1-lab-skills-and-matter/1-7-phase-change-diagrams/
​

1-What are 4 things you notice about this graph?

2-In what form is the energy most likely added?

3-Using the context clues on the graph, what do you think MP and BP stand for?

4-In which temperature scale (Celsius or Fahrenheit) is the Y-axis numbered?  Why do you think so?

5-How much did the temperature of the ice rise until it melted?

6-Between which temperatures is it liquid?

7-Based on the information in the graph, how would you define evaporation?

8-Complete the sentence.  As energy increases, ______ increases.  


​
0 Comments
<<Previous

    Helpful GrapHING
    ​Links

    5mm Graph Paper - PDF
    Virtual Online Graph Paper
    Dot Paper - PDF
    Isometric Graph Paper - PDF
    Kids Create A Graph
    NY Times: What's Going on in This Graph?
    Turner's Graph of the Week

    Looking for More?

    • What Do You Know about Mines in SC?
    • So, When is High Tide?
    • What's the Climate in Charleston, SC?
    • Comparing Vaccine Development
    • Screen Time 2021​
    • Melting & Boiling Points of Metals
    • ​Examine a Heating Curve


Picture


This website has been developed and maintained by
Kimberly G. Massey, K-12 Science Instructional Specialist
for Rock Hill Schools of York County, South Carolina.


Telephone

803.981.1886

Email

kmassey@rhmail.org
  • Home
  • Blog
  • Data
  • Elementary Science
    • 4K Science Suggestions
    • 5K Science
    • 1st Grade Science
    • 2nd Grade Science
    • 3rd Grade Science
    • 4th Grade Science
    • 5th Grade Science
  • Middle School Science
    • 6th Grade Science >
      • 6thSCREADYPrep
    • 7th Grade Science
    • 8th Grade Science
    • MS SCPASS Preparation
    • Workshop Model
    • Lab Reports
  • High School Science
    • Workshop Model
    • Biology >
      • Biology EOC Review >
        • Biodata2022
      • Bio NGSS
    • HS Science Resources
    • ACT Science Prep
    • ASVAB Prep
  • More
    • ScienceFair
    • ESOL
    • 2021 SC Science Standards - NEW!
    • Lab Safety
    • Science & Engineering Practices
    • Disciplinary Literacy
    • COVID-19
    • STEM
    • Remote Learning Resources