6.E.2 Earth's Weather and Climate
Make this unit relevant!
- Watch the weather forecast as a class - daily or weekly - during this unit! Use www.wcnc.com/weather or www.weather.com
- Hurricane season is June 1 to November 30. Students should learn hurricane tracking. Use this video made specifically for Rock Hill Schools! Use this tracking map from the National Oceanic Atmospheric Association.
6.E.2A.1 Develop and use models to exemplify the properties of the atmosphere (including the gases, temperature and pressure differences, and altitude changes) and the relative scale in relation to the size of Earth.
|
|
Watch the video.
|
Composition of the Air
According to NASA, Earth's air is made of a mixture of gases. The gases in Earth's are are Nitrogen, Oxygen, Argon, Carbon Dioxide and very small, trace amounts of Neon, Helium, Methane, Krypton, Hydrogen, and Water Vapor. Most people assume that the air is mostly Oxygen because that's what people breathe. This is not true. The air is actually mostly Nitrogen. 78% of the air is Nitrogen, while 21% of the air is Oxygen. This is good because Oxygen supports flames. If the air were mostly oxygen, we wouldn't be able to light the candles on a birthday cake! About .93% of the air is Argon, .04% is Carbon Dioxide and .03% is a mixture of Neon, Helium, Methane, Krypton, Hydrogen, and Water Vapor.
According to NASA, Earth's air is made of a mixture of gases. The gases in Earth's are are Nitrogen, Oxygen, Argon, Carbon Dioxide and very small, trace amounts of Neon, Helium, Methane, Krypton, Hydrogen, and Water Vapor. Most people assume that the air is mostly Oxygen because that's what people breathe. This is not true. The air is actually mostly Nitrogen. 78% of the air is Nitrogen, while 21% of the air is Oxygen. This is good because Oxygen supports flames. If the air were mostly oxygen, we wouldn't be able to light the candles on a birthday cake! About .93% of the air is Argon, .04% is Carbon Dioxide and .03% is a mixture of Neon, Helium, Methane, Krypton, Hydrogen, and Water Vapor.
|
In your Science notebook:
1. Use a ruler to make a chart of the gases that compose the air. 2. Trace a circle, then inside make a pie graph of the composition of the air. |
Layers of the Atmosphere
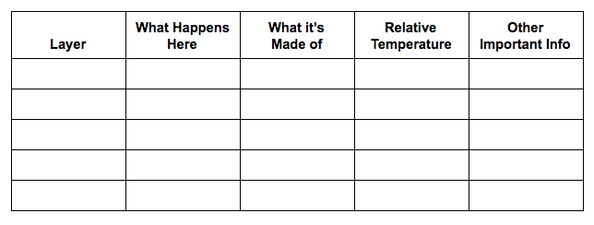
Part A. Earth's atmosphere has different layers that differ in altitude, composition, and temperature. Go to this page, scroll down to Layers of the Atmosphere and read. Make the chart in your Science notebook. Your boxes will need to be larger than those shown below.
Part A. Earth's atmosphere has different layers that differ in altitude, composition, and temperature. Go to this page, scroll down to Layers of the Atmosphere and read. Make the chart in your Science notebook. Your boxes will need to be larger than those shown below.
|
Quick Check
|
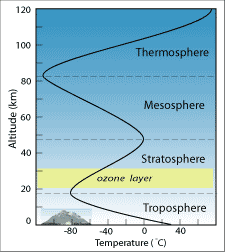
1. In what unit of measure does this graph show altitude? A) meters B) feet C) kilometers D) Celsius 2. According to the graph, at what altitude does the ozone layer begin and end? A) begins in the troposphere and ends in the stratosphere B) begins at 20km and ends at 32km C) begins at 20km and ends at 30km D) begins at 20km and ends at 40km 3. According to the graph, what happens to the temperature as the altitude of the Mesosphere increases? A) temperature increases B) temperature decreases C) temperature stays the same D) temperature varies |
6.E.2A.2: Critically analyze scientific arguments based on evidence for and against how different phenomena (natural and human induced) may contribute to the composition of Earth’s atmosphere.
|
Watch the video. Answer the following in your Science notebook.
1. How does a greenhouse work? 2. What does earth's atmosphere do for the earth? 3. Explain the concept of heat-trapping gases. 4. Which gases are greenhouse gases? 5. What are some human activities that change earth's greenhouse effect? 6. How do these activities change the atmosphere? 7. What evidence do we have that greenhouse gases are changing our atmosphere? Which greenhouse gas, in particular is having this effect? 8. Go to climate.nasa.gov/kids to see what else you may learn. |
|
Is Climate Change Really Happening?
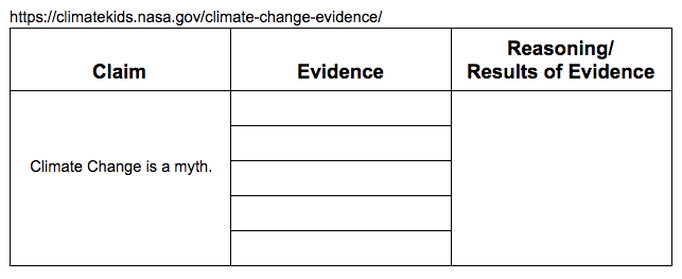
If you have seen any news recently, you are aware that there is debate as to whether or not climate change is real. You may have your own opinion, but please read about climate change, list the evidence, then write your conclusion answering the question - Is Climate Change really happening? Make the chart in your Science notebook. Use this website, or others you may be able to locate.
If you have seen any news recently, you are aware that there is debate as to whether or not climate change is real. You may have your own opinion, but please read about climate change, list the evidence, then write your conclusion answering the question - Is Climate Change really happening? Make the chart in your Science notebook. Use this website, or others you may be able to locate.
|
Quick Check
|
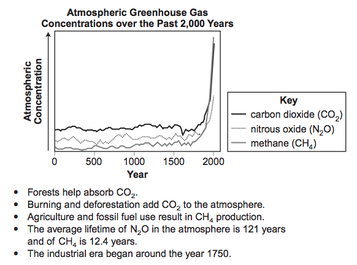
4. Would it be true to say that carbon dioxide, nitrous oxide, and methane levels fluctuate each year, but since about 1750, the levels have begun to drop dramatically? Explain your answer. 5. Look at the first 2 bullet points. Explain how burning and deforestation add CO2 to the atmosphere. 6. Find 1750 on the graph. How would the industrial revolution be linked to the atmospheric gas levels? |
6.E.2A.3: Construct explanations of the processes involved in the cycling of water through Earth’s systems (including transpiration, evaporation, condensation and crystallization, precipitation, and downhill flow of water on land).
|
Watch the video.
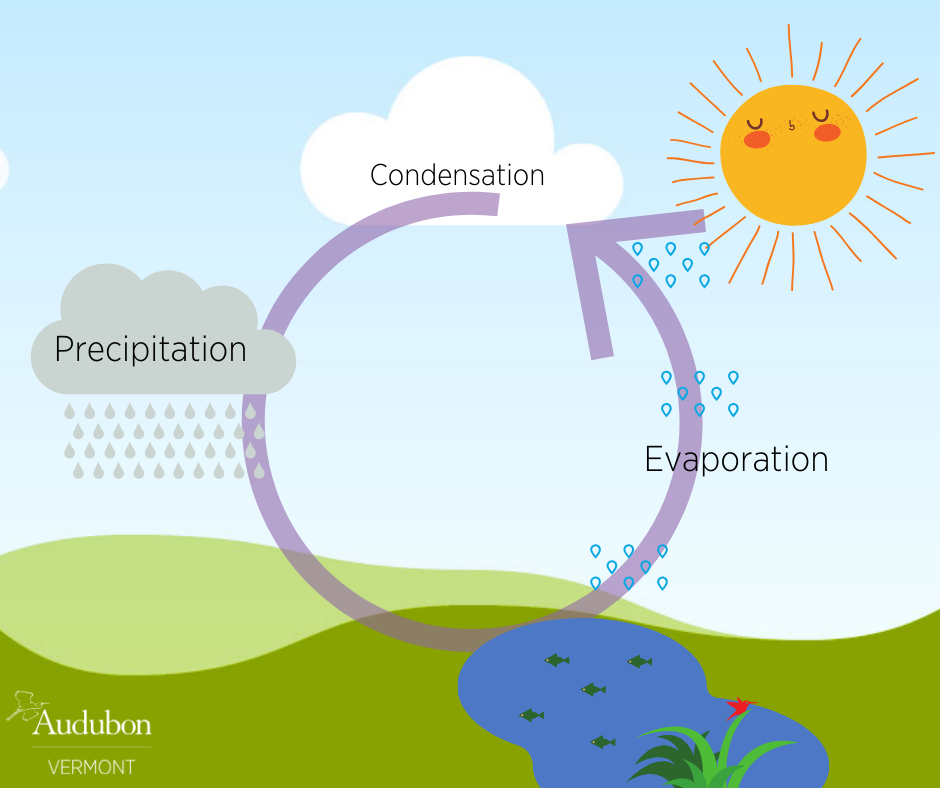
Copy and complete the questions in your Science notebook. 1. The water cycle can be summarized in 2 words: ______ and ______ 2. Water is always ________. 3. What is precipitation? What are the different forms? 4. What is evaporation? What drives evaporation? 5. Transpiration is like ____, but it comes from ____. 6. Condensation is ________. Extra Credit: Write down 4 new words you learned, and define them. |
|
|
Often, we see the water cycle depicted as a circle, as shown to the left. While this depiction is not incorrect, students think of it on a small scale, but actually the water cycle is global. The water molecules that fall on Rock Hill as rain today, may have once fallen on Australia or Japan. Those same water molecules may have once been at part of the Indian Ocean or the Pacific Ocean. They may have been a part of a glacier or they may have once been frozen as hail that fell on Paris. The earth is in constant motion, both rotating on its axis and revolving around the sun. As you heard in the video, water is always in motion, too! Earth's motion, independent of the clouds which store water, plus our winds, and the sunlight that heats the earth makes the water cycle global. The water that evaporated from Lake Wylie doesn't necessarily fall back into Lake Wylie as rain - some of it may, but likely not.
|
|
Your assignment: Pretend you are having a conversation with a friend about the water cycle. Your friend does not understand that the water cycle is global. How can you get him/her to understand. Write the conversation with at least 8 exchanges.
-To the left are a few links that may help you understand. -Check with your teacher about extra credit if you and a friend perform the conversation and video it as a skit. Sample Conversation Friend: It sure is hot today, and it's sticky, too. All this evaporation means it's gonna rain tomorrow. You: Yeah, it might rain, but it might not rain here, it might rain in California. Friend: |
6.E.2B.1: Analyze and interpret data from weather conditions (including wind speed and direction, air temperature, humidity, cloud types, and air pressure), weather maps, satellites, and radar to predict local weather patterns and conditions.
|
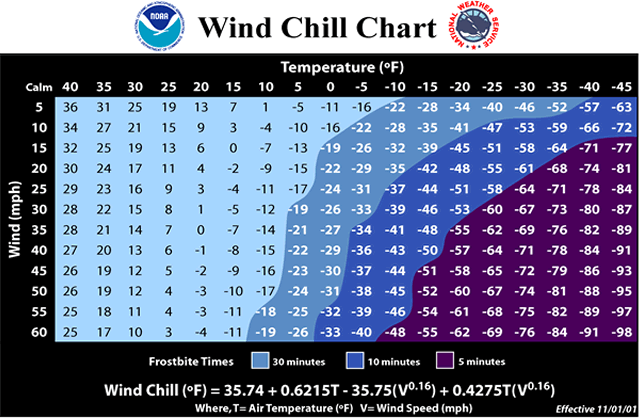
Often, scientists communicate with charts and graphs because they can share lots of information in a brief manner. This chart shows how wind and temperature interact to produce wind chill. Wind chill is the the "feels like" temperature once we factor in wind. Knowledge of wind chill can help us to assess our risk of frostbite. More about frostbite - here's a video. For more information, visit this link. |
|
Questions:
1. This chart measures wind speed in _____. What device is most likely used to measure wind speed? 2. This chart measures temperature in _____. What other temperature scale could have been used? 3. Look at the key. What do the different shades of blue and purple mean? 4. Based on the chart, frostbite would be unlikely if the wind speed were less than _____, and the temperature were more than _____. 5. What would the wind chill be if the wind speed is 35mph and the temperature were 20 degrees Fahrenheit? ____ What does this mean? How long would it take for someone experiencing this to develop frostbite? 6. What would be the wind chill if the wind speed were 15mph and the temperature were -10 degrees Fahrenheit? _____ How long would it take for someone experiencing this to develop frostbite? 7. Based on the overall chart, what trends do you see about wind chill and the time to develop frostbite? |
6.E.2B.2: Develop and use models to explain how relationships between the movement and interactions of air masses, high and low pressure systems, and frontal boundaries result in weather conditions and storms (including thunderstorms, hurricanes and tornadoes).
|
|
Watch the video. As you watch write down 5 questions that can be answered with information you learn in the video. After you watch, write a summary of what you learn using the questions you wrote as a guide. |
|
Watch today's weather forecast from WCNC News out of Charlotte, NC. As you watch, write a list of weather terms you hear. What references to air pressure, air masses, or storms do you hear? How can you explain these occurrences based on what you learned from your teacher or from the previous video? |
6.E.2B.3: Develop and use models to represent how solar energy and convection impact Earth’s weather patterns and climate conditions (including global winds, the jet stream, and ocean currents).
6.E.2B.4: Construct explanations for how climate is determined in an area (including latitude, elevation, shape of the land, distance from water, global winds, and ocean currents).
|
1. How is the earth heated?
2. Sketch a large diagram and write a caption to explain why the heating of the earth is uneven. In your diagram mark the polar and tropical regions. |
3. In the diagram you drew for #2, mark the three cells.
|
4. Explain the Coriolis Effect.
5. Fill a sink with water then, watch as it goes down the drain. Which way does it swirl? Flush a toilet-which way does the water swirl? Explain this in terms of the Coriolis Effect. |
6. What are jet streams?
7. On the diagram you drew, use a colored pencil to note and label the jet streams. |
|
Let's try an experiment!
Title: Which heats up faster, sand or water?
Hypothesis: Materials: 2 thermometers, 2 identical containers, sand, water, a scale, a bright light/lamp Procedure: (What steps would you take to answer the title question using the materials listed above? Write your procedure. Draw a sketch of how you would set up your experiment.) Data: (Design a data chart to collect temperature measurements from your experiment.) Results: (Based on the data, what is the answer to your title question?) Conclusions: (Based on the data and observations what do you think about your results? How is this information important? Have others who tried this experiment obtained the same results? What additional, related experiment(s) could you try? What if you had another thermometer - how might that have helped your experiment?) |

